Stocks ended another strong week, continuing the trend of buyers stepping up in October. Several years have seen October kill off bear markets, and 2022 may join that list. In fact, the only two years that started off worse for the S&P 500 than 2022 were 1974 and 2002, and both of those vicious bears ended in early October.
- The October rally continues, with the Dow approaching one of its largest gains ever.
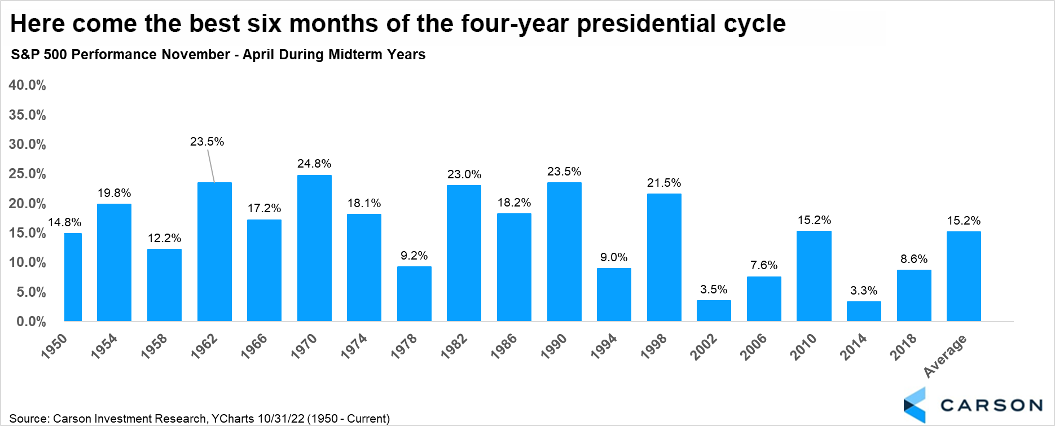
- Historical returns indicate the next six months could be very strong.
- Earnings season has been strong overall, but some high-profile tech misses are getting all the headlines.
- Economic growth picked up in the third quarter, with GDP rebounding to 2.6% after two negative quarters.
- There is marked divergence under the hood. Strong services consumption is being countered by falling housing activity amid surging mortgage rates.
Tech has lagged recently, and many big names have disappointed during this earnings season. While financial news is focused on tech’s underperformance, many other sectors are experiencing positive earnings growth, suggesting the economy is likely stronger than most economists think. The Dow is up more than 14% in October, marking the best October return ever and potentially the best month since 1976. The good news is huge monthly gains are not typically followed by poor performance. Historically, stocks tend to do quite well after big months. Since World War II there have been 11 months in which the Dow rose at least 10%, and a year later stocks had gained another 16% on average. In other words, big moves like October’s surge tend to take place closer to the start of a bull market, not the end.
The Best Six Months Are Finally Here
History tells us that midterm-election years can be rough for stocks, especially early in the year. However, the months following the election are some of the best of the entire four-year presidential cycle.
In fact, November through April during a midterm year has been higher each of the past 18 years. We are optimistic a major market low is taking place currently, and this is yet another clue that better times could be coming. Remember, the stock market doesn’t look in the rearview mirror; it is always looking forward. Just because the past has been poor doesn’t mean the future will follow suit.
Earnings Dominated by Negative Tech Headlines
Just about half the companies in the S&P 500 have reported earnings for the third quarter, but some large tech misses have dominated headlines. Technology makes up a significant part of the S&P 500 index, but other important sectors have done well. The energy sector reported several positive earnings surprises. While energy makes up just about 5% of the index, it is the biggest contributor to the S&P 500’s revenues and earnings. Also notable is the airlines industry reported a profit of $3 billion in the third quarter compared to a loss of $731 billion a year ago. That’s a reflection of strong consumer spending on the services side, even as goods consumption has slowed.
The blended profit margin for the S&P 500 is 12%, which is higher than the five-year average of 11.3% and only slightly below last quarter’s 12.2%.
Economic Growth Picked Up, But Much Goes on Behind the Data
On the face of it, the third quarter GDP report was very positive, with growth rebounding to 2.6% quarter-over-quarter (annualized). This pushed back the question of whether the economy is in a recession, although many of these numbers can and will be revised in the future. But make no mistake, growth has slowed considerably this year. The economy grew 0.1% over the first three quarters of 2022, compared to 4.1% over the last three quarters of 2021.
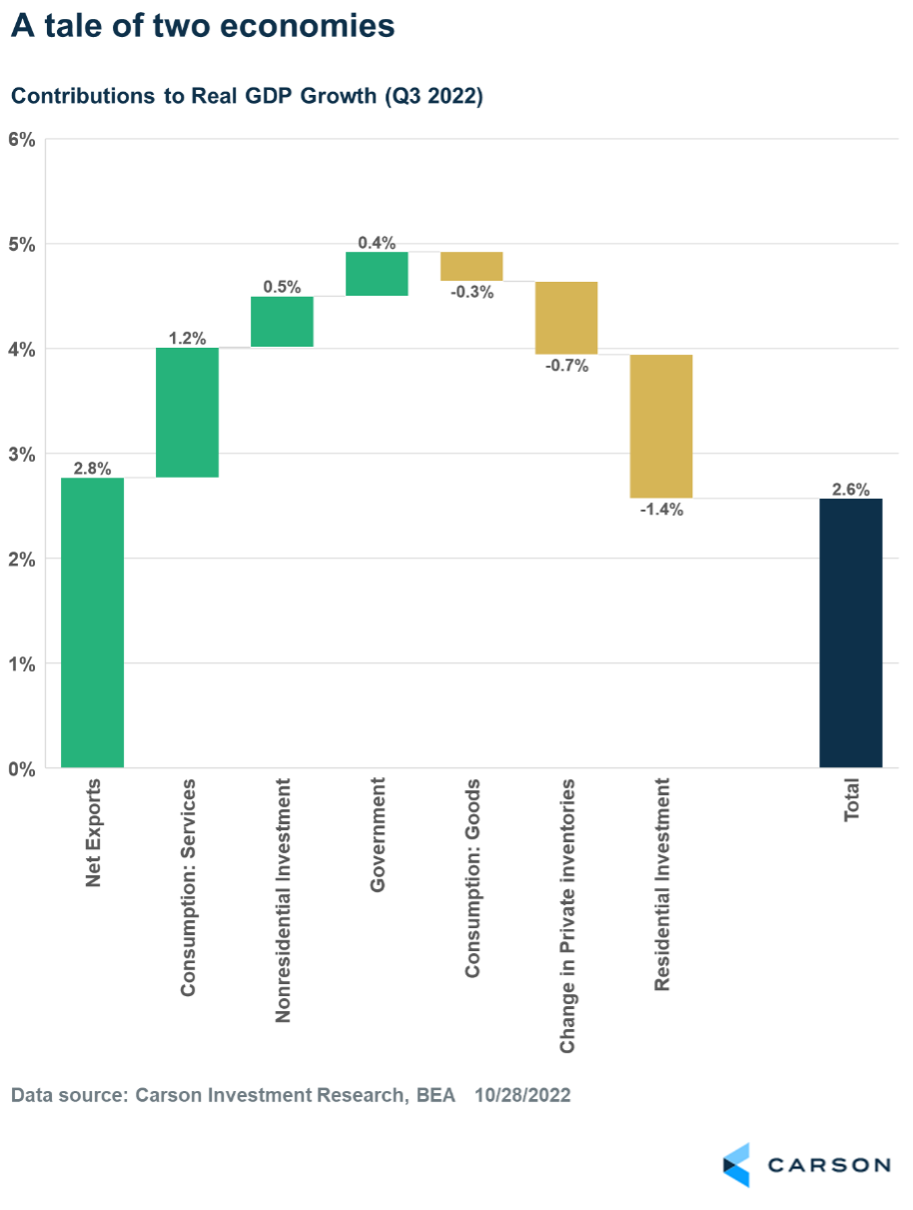
As with much of this data, it’s always useful to look under the hood. In this case, a breakdown of how the various major components of GDP contributed to growth in the third quarter:
The biggest single contributor to GDP growth was “net exports,” which is exports minus imports. Exports surged 14% during the quarter (annualized rate) even as goods imports fell by almost 9%. Foreigners bought more U.S. goods and services as Americans cut back on goods spending. This category tends to be volatile, so it’s advisable to view it in a broader context.
The numbers came down to two competing stories: services versus residential investment, i.e. housing.
As the chart above shows, goods consumption was a drag on GDP growth in the third quarter. Spending on goods fell about 1%, mostly driven by fewer purchases of cars, gasoline, and groceries.
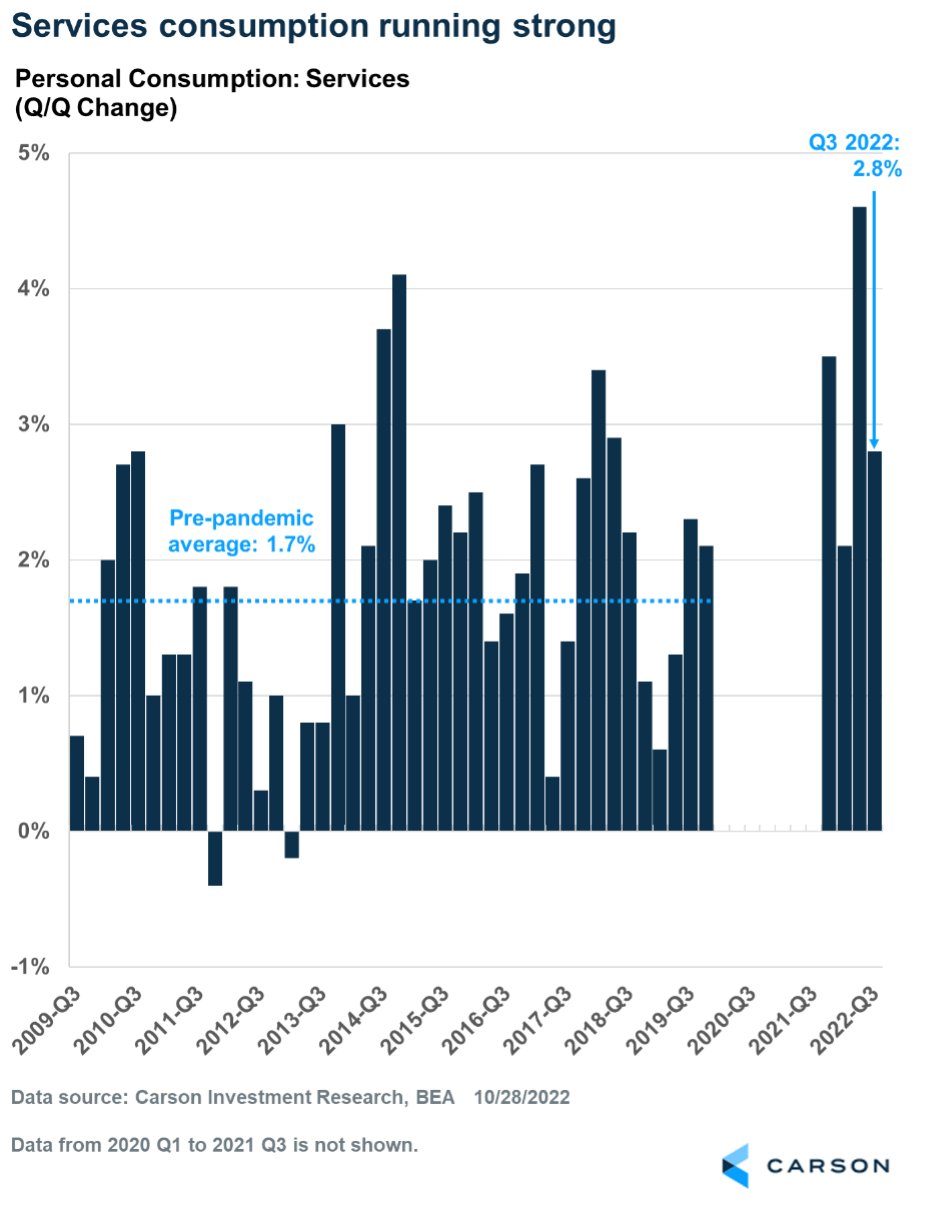
But consumers did spend — they just spent a lot on services. While services spending slowed from a torrid 4.6% pace in the second quarter, that was never sustainable. For perspective, the 2.8% pace in the third quarter is well above the average pace of services spending prior to the pandemic (about 1.7%).
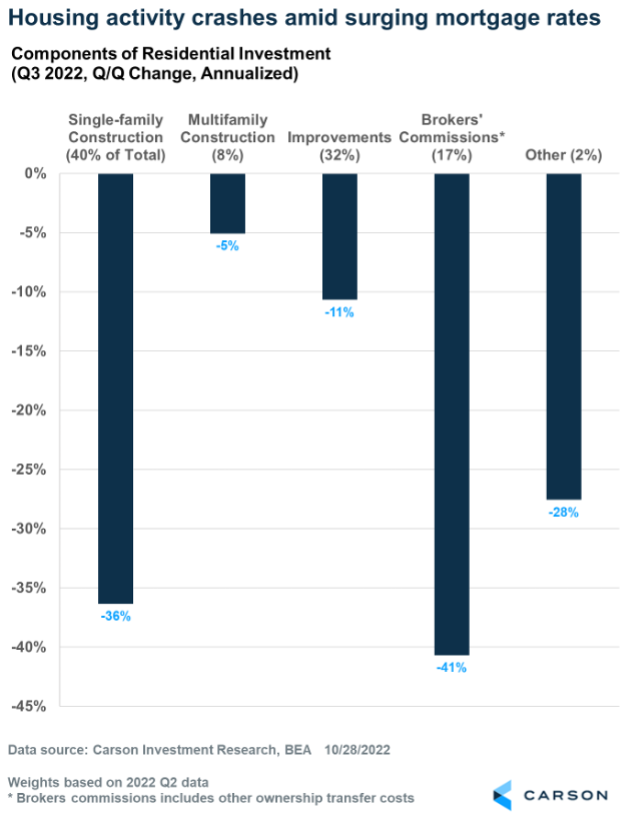
On the other side was residential investment, which makes up only about 3% of GDP. It completely negated the strong services number by falling a whopping 26% over the third quarter! The reason is clear — an aggressive Federal Reserve hiking rates to get on top of inflation. Interest rate increases have led to a surge in mortgage rates, which in turn has led to a complete reversal of housing activity.
Residential investment consists of three main components: home construction (single-family and multi-unit), improvements/renovations, and broker commissions/other costs related to sales. As the chart below shows, each of these components crashed last quarter, especially single-family construction as builders pulled back and brokers’ commissions as sales activity fell.
Housing activity is plunging, and expect that to continue as mortgage rates rise above 7%. The good news is that decline is currently being countered by spending on services, powered by rising incomes and strong balance sheets.
This newsletter was written and produced by CWM, LLC. Content in this material is for general information only and not intended to provide specific advice or recommendations for any individual. All performance referenced is historical and is no guarantee of future results. All indices are unmanaged and may not be invested into directly. The views stated in this letter are not necessarily the opinion of any other named entity and should not be construed directly or indirectly as an offer to buy or sell any securities mentioned herein. Due to volatility within the markets mentioned, opinions are subject to change without notice. Information is based on sources believed to be reliable; however, their accuracy or completeness cannot be guaranteed. Past performance does not guarantee future results.
S&P 500 – A capitalization-weighted index of 500 stocks designed to measure performance of the broad domestic economy through changes in the aggregate market value of 500 stocks representing all major industries.
The NASDAQ 100 Index is a stock index of the 100 largest companies by market capitalization traded on NASDAQ Stock Market. The NASDAQ 100 Index includes publicly-traded companies from most sectors in the global economy, the major exception being financial services.
Compliance Case # 01535775


