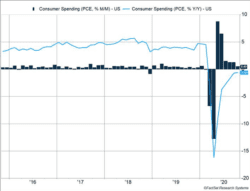
The economy seems poised to decelerate in coming weeks as data showed slowing economic improvement or outright reversals of the recovery. Income data was mixed. Disposable income fell 0.8% in October as government programs expired. Gains in employment pushed employee compensation up 0.7% as more people returned to work. Even with the gains, employee compensation remains 4% below trend. Personal consumption growth remained positive, rising 0.5% in October, after climbing 1.2% the two previous months (Figure 1).
Key Points for the Week
- Initial unemployment claims increased again this week as coronavirus cases surged.
- Personal income and spending reflected COVID-19’s renewed strength and the expiration of some CARES Act provisions.
- The S&P 500 reached a new record, and the Dow Jones Industrial Average closed above 30,000 for the first time.
Initial jobless claims rose 30,000 last week to 778,000, continuing last week’s increase. The initial claims data is reported only four days after it is compiled, making it an early warning sign the economy may be slowing. The data fits into our view the economy will slow as efforts to contain the virus will reduce economic activity.
Markets celebrated a milestone as the Dow Jones Industrial Average closed above 30,000 for the first time early last week. The S&P 500 also reached a new high and climbed 2.3% despite weaker than expected economic news. The global MSCI ACWI index rose 2.4%. The Bloomberg BarCap US Aggregate Bond Index was unchanged. Markets were reassured when it was announced former Fed Chair Janet Yellen would be nominated to lead the U.S. Treasury Department.
The big economic news this week will be the monthly employment report. Korea and Japan will report retail sales and industrial production data. Key cabinet picks by President-elect Biden may also move markets. Positions affecting financial regulation and trade policy will be watched closely.
Figure 1
Counting Isn’t as Easy as It Looks
The Dow Jones Industrial Average closed above 30,000 for the first time early last week. The venerable index dipped slightly after that and finished the week just below 30,000. The S&P 500 also reached a new high. While point totals with lots of round numbers tend to get investors excited, focusing on point totals isn’t recommended.
One of the keys to surviving a down market is to think percentages rather than points or dollars. Measuring returns by points means investors get more excited about big moves that really aren’t as big as they used to be.
If the Dow drops 300 points when it is above 30,000, it is falling less than one percent. A 300-point drop used to be a major move in the market. Now it will be much less surprising and not particularly rare. There have been 106 moves of more than 1% during this volatile year.
You may wonder why we don’t cover the Dow in our weekly report. The Dow uses an uncommon weighting scheme that causes stocks with higher prices to have more impact on the index. So, when a company in the Dow splits its stock, a 1% move has less impact than it did before the split even though it is the same company. It also only includes 30 stocks and isn’t as diversified as broader indices, such as the S&P 500 or globally oriented MSCI All Cap World Index (ACWI).
Indices track more than financial markets. The S&P Case-Shiller US Composite National Index, which tracks home prices, is one we have been watching more closely than normal. Over the last year, housing prices have risen 7% and are now 22.2% higher than they were at the peak of the 2008 financial crisis. Some clients are asking whether we are concerned housing might be moving toward another bubble.
The quick answer is we don’t see ominous signs of a new housing bubble. If prices are adjusted for inflation, they are still 2% below the financial crisis peak, and we would expect housing prices to show modest long-term appreciation. In addition, the boom in housing prices preceding the financial crisis relied heavily on leverage. Today’s market is more tied to fundamentals. Prime-age millennials represent attractive buyers, and COVID-19 is altering what people are looking for in homes. The demand is real and not as speculative as it was during the financial crisis. Improved financial regulation has also reduced the risk of a housing bubble.
One risk worth watching is how changes in policy may undercut the housing rally. In the near-term, housing delinquencies are rising rapidly. Last month, 7.6% of all loans were past due, and loans more than 90 days past due are also spiking. Much of the reason is the CARES Act allowed owners to defer payments if they were affected by COVID. That provision expires on Dec. 31 and poses a challenge as employment trends are worsening. Our expectation is the government will extend the forbearance option, but a risk remains it will not. If the job situation improves, the delinquent payments will likely be caught up over time or through a mortgage refinance. Otherwise, selling is a potential option.
Of course, being forced to sell can hurt important parts of life not measured well by dollars and cents. As noted above, one of the problems with the Dow is its method of measurement isn’t as effective at evaluating the strength of the stock market as other indices. The same could be true in using our portfolio returns or home price to measure how well the year is going. Health issues, the lack of interaction, and the loss of loved ones has made this a difficult time and reminds us our finances are only a piece of our lives. Please, stay safe.
—
This newsletter was written and produced by CWM, LLC. Content in this material is for general information only and not intended to provide specific advice or recommendations for any individual. All performance referenced is historical and is no guarantee of future results. All indices are unmanaged and may not be invested into directly. The views stated in this letter are not necessarily the opinion of any other named entity and should not be construed directly or indirectly as an offer to buy or sell any securities mentioned herein. Due to volatility within the markets mentioned, opinions are subject to change without notice. Information is based on sources believed to be reliable; however, their accuracy or completeness cannot be guaranteed. Past performance does not guarantee future results.
S&P 500 INDEX
The Standard & Poor’s 500 Index is a capitalization-weighted index of 500 stocks designed to measure performance of the broad domestic economy through changes in the aggregate market value of 500 stocks representing all major industries.
MSCI ACWI INDEX
The MSCI ACWI captures large- and mid-cap representation across 23 developed markets (DM) and 23 emerging markets (EM) countries*. With 2,480 constituents, the index covers approximately 85% of the global investable equity opportunity set.
Bloomberg U.S. Aggregate Bond Index
The Bloomberg U.S. Aggregate Bond Index is an index of the U.S. investment-grade fixed-rate bond market, including both government and corporate bonds
https://www.bea.gov/news/2020/personal-income-and-outlays-october-2020
https://www.cnbc.com/2020/11/25/us-weekly-jobless-claims.html
https://www.wsj.com/articles/dow-30000-covid-economy-market-buy-and-hold-11606238819
https://www.calculatedriskblog.com/2020/11/black-knight-national-mortgage.html
Compliance Case: 00885861


