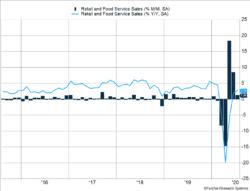
U.S. economic data last week supported the view the U.S. is entering a period of slower economic growth after a sharp recovery in May and June. Mandatory and voluntary social distancing efforts limit how quickly the economy can recover when certain segments, such as restaurants, are still struggling. Retail sales, as shown in Figure 1, rose 1.2% after much more rapid increases in recent months. Initial unemployment claims dipped below 1 million for the first time since March but reflect an employment situation in turmoil.
Key Points for the Week
- A bevy of economic reports indicates the U.S. economy is transitioning toward a slow recovery after a quick rebound in several areas spurred rapid growth in May and June.
- Initial unemployment claims dipped below 1 million, and retail sales in the U.S. rose 1.2% while falling a similar amount in China.
- The S&P 500 edged 0.7% higher last week, setting a new high.
China’s recovery plan seems to be following its old playbook of manufacturing and exporting its way out of a slowdown. Industrial production surged 4.8% last month, exports increased 7.3%, while imports dropped 0.9%. One reason for the decline in imports is the Chinese consumer scaled back spending. Chinese retail sales dropped 1.1% in July.
Global stock investors continue to look past current data toward an expected future recovery. The S&P 500 added 0.7%, raising its year-to-date gain to 5.7% and sending it to a new record. The MSCI ACWI tacked on 1.1% to its yearly gains. The Bloomberg BarCap Aggregate Bond Index dipped 0.9% on strong inflation data in the U.S.
This week will be a quiet one economically. Negotiations on another relief package seem stalled over how much support the bill should provide states and local governments. Progress on this issue is very important as retail sales would likely have been lower in July without government assistance. The closer we get to an election, the more difficult the issue becomes to resolve.
Figure 1
Variations on a Theme by COVID-19
Last week’s economic data suggest the U.S. economy and stock market have started to resemble a classical music piece where the main pattern or theme is repeated with variations each time it is played. Often a composer will take a theme from a different composer and adjust it in different ways throughout the new piece.* The second composer will speed it up, add a note, take away a note, or make other changes each time through. The music follows a central theme with variations in different directions.
We expect the economy to follow a similar theme of slow progress, peppered with surprising variations. This trend is likely to continue through the end of the year and until enough medical progress is made to allow additional activities to take place. Even when the virus becomes well controlled, relaxation of social distancing by the government or individuals seems to bring in a new surge. For example, South Korea made significant strides in lowering case levels, only to see them spike in recent weeks and force the reinstatement of some social distancing policies.
The virus’s propensity to resurge throws a wrench in the plan to loosen restrictions once it seems contained. Thus, governments continue to maintain restrictions, companies set additional safety rules, and individuals voluntarily avoid certain activities. All these steps create an environment where the economy is likely to edge forward at a slow pace.
Last week’s global economic data bolstered the theme of slowing growth amidst extended social distancing. Within the slowing theme, there were some surprising variations. Below is a summary of some key data points:
- Retail sales and food services rose 1.2%, missing expectations [Figure 1]. Even with the slower growth, sales are fully recovered. They have risen 2.7% over the last year and are 1.7% higher than the peak in February. Restaurants and bars remain the biggest drag on sales, down 19% from last year. While improving, growth slowed from 18.3% in May and 8.4% in June and remains below the pre-crisis annual growth trend of 5%.
- The employment picture in the U.S. is also slowly improving. Initial unemployment claims dipped below 1 million for the first time since March. Unemployment claims from self-employed workers are below 500,000 and have dropped sharply in recent weeks. Continuing unemployment claims remain above 15 million.
- Industrial production rose 3% in the U.S. while remaining 8.2% lower than one year ago. Auto production rose 28% in July as manufacturing plants find it easier to social distance. One variation we expect in the COVID world is more cars driven less frequently as people use cars to venture out while working from home more often.
- China’s economy saw similar trends. Retail sales dropped 1.1%, while industrial production rose 4.8%. The slow growth in retail sales for the country that wrestled with the virus first shows how even the threat of a surge can limit the economic recovery.
- The surprising variation was consumer price inflation rising 0.6% in July. The surge surprised economists as inflation had been miniscule prior to last month. Including the 0.6% increase, inflation is still only 1.0% higher over the last year.
Overall, the numbers moved according to our expected theme. China’s retail sales decline showed the world’s second largest economy may not be much help in fueling a global recovery. The inflation data is a risk worth watching. Social distancing measures can be expensive, and some businesses appear to have successfully passed these costs on to customers. Our view is the Fed will treat this sharp spike as a strange variation that will not upset its view that the global economy will need support, in the form of low rates, for quite a while.
*My favorite is Ralph Vaughan Williams’s Fantasia on a Theme by Thomas Tallis.
—
This newsletter was written and produced by CWM, LLC. Content in this material is for general information only and not intended to provide specific advice or recommendations for any individual. All performance referenced is historical and is no guarantee of future results. All indices are unmanaged and may not be invested into directly. The views stated in this letter are not necessarily the opinion of any other named entity and should not be construed directly or indirectly as an offer to buy or sell any securities mentioned herein. Due to volatility within the markets mentioned, opinions are subject to change without notice. Information is based on sources believed to be reliable; however, their accuracy or completeness cannot be guaranteed. Past performance does not guarantee future results.
S&P 500 INDEX
The Standard & Poor’s 500 Index is a capitalization-weighted index of 500 stocks designed to measure performance of the broad domestic economy through changes in the aggregate market value of 500 stocks representing all major industries.
MSCI ACWI INDEX
The MSCI ACWI captures large- and mid-cap representation across 23 developed markets (DM) and 23 emerging markets (EM) countries*. With 2,480 constituents, the index covers approximately 85% of the global investable equity opportunity set.
Bloomberg U.S. Aggregate Bond Index
The Bloomberg U.S. Aggregate Bond Index is an index of the U.S. investment-grade fixed-rate bond market, including both government and corporate bonds
https://www.musictheoryacademy.com/understanding-music/theme-and-variations/
https://www.koreatimes.co.kr/www/nation/2020/08/119_294462.html
https://www.dol.gov/ui/data.pdf
https://www.ft.com/content/b05fd541-d451-4cac-b3d3-c4192bd16264
Other data sourced via Factset
Compliance Case: 00804370


